
In the fall of 2016, Dr. Clayton Nylund completed his dissertation, titled “Adequate Funding for Primary Education in the Artibonite Department of Haiti”, through the University of Florida. His findings are included below:
ABSTRACT
Since its formation following a slave revolution in 1804, the Republic of Haiti has a long history of political instability, civil unrest and poverty. As of 2015, Haiti’s gross domestic product (GDP) was US$1,732, per capita, making it the poorest country in the Western Hemisphere. Haiti’s education sector was no exception to this sparsity, receiving only 2.5 percent of the nation’s overall GDP. The purpose of this study was to determine adequate funding for Haitian primary schools based upon mathematical achievement levels and the professional judgment of site-based administrators. A Florida Comprehensive Assessment Test (FCAT), originally administered to Florida’s third-grade students in 2006, was utilized to determine mathematical achievement. In 2015, the translated FCAT was administered to 207 students, enrolled in four schools, located in the lower Artibonite department of Haiti. The results indicated that the sample answered sixteen of the forty mathematics questions correctly, on average. Based on these results, the four site-based administrators recommended the funding amounts necessary to increase mathematical achievement by 15 percent. The average annual amounts, in US dollars, included $461 per teacher salary, a $540 administrative salary, $40 per student for instructional materials, $367 per student for meals, and $37 per student for uniforms.
DATA
Table 1.1: Descriptive statistics of Haitian achievement.

Table 1.2: Haitian achievement by grade-level (correctly answered questions are represented as a percentage of the total number of questions).
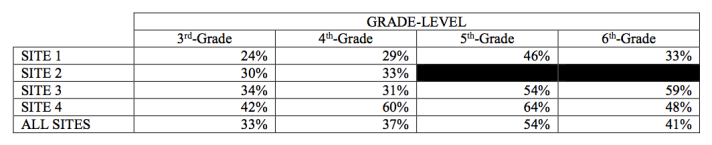
Figure 1.1: Haitian achievement by grade-level.
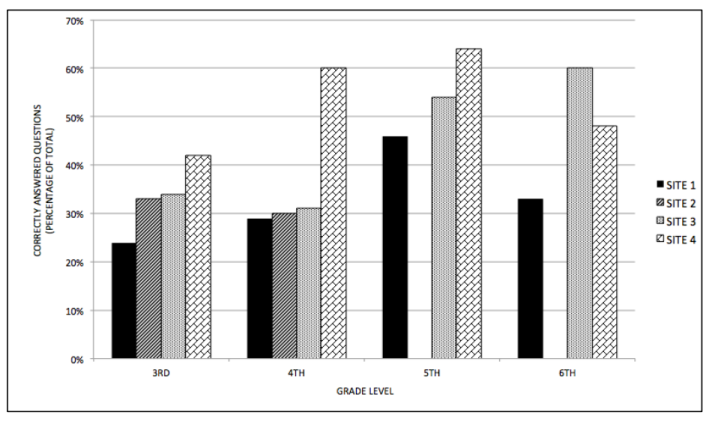
Table 1.3: Haitian achievement by age (correctly answered questions represented as a percentage of the total number of questions).

Figure 1.2: Haitian achievement by age.
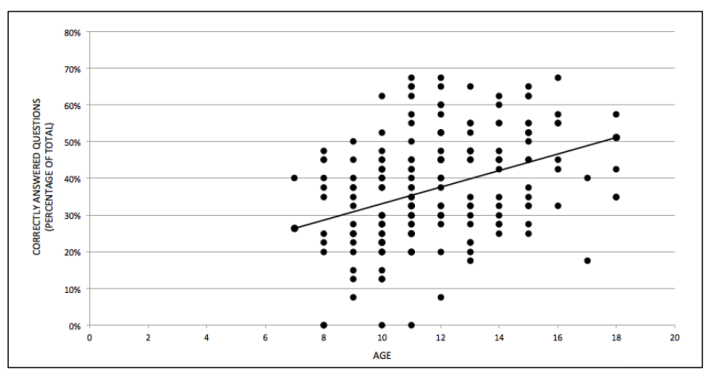
Table 1.4: 2006, third-grade, mathematics FCAT categories.

Table 1.5: Haitian achievement by assessment category (correctly answered questions represented as a percentage of the total number of questions).

Figure 1.3: Haitian achievement by assessment category.

Table 1.6: Third-grade Haitian achievement and third-grade Floridian achievement by assessment category and overall (correctly answered questions represented as a percentage of the total number of questions).

Table 1.7: Adequate funding information according to Haitian administrators. Values are represented in the Haitian Gourde (HTG) and the U.S. Dollar (USD).

The full dissertation can be viewed by request via the University of Florida. http://www.ufl.edu
